Triangle Regional Model (TRM)
The Triangle Regional Model (TRM) is a state of the practice regional transportation planning model, also known as a regional travel demand model. The TRM is developed and maintained by the Triangle Regional Model Service Bureau (TRMSB) within the Systems Planning and Analysis Group at ITRE and four stakeholder sponsors: NC Department of Transportation, Durham-Chapel Hill-Carrboro Metropolitan Planning Organization, Capital Area Metropolitan Planning Organization, and GoTriangle. In addition to ITRE TRMSB team members, travel modelers from the sponsoring agencies also support work activities related to the TRM. Together this group forms the TRM Team.


![]()
![]()
Official Triangle Regional Model
The current official model is the TRMG2 v2.0, which corresponds to the 2055 MTP and is available here along with Technical Documentation and the User Guide. A summary of key information on TRMG2 is provided within this factsheet.
What is it?
A transportation planning model is a series of mathematical equations that represent the transportation system and the travel choices that people make as they participate in activities. The transportation system is represented by roadway and transit networks. The TRM includes all major roads in the region and transit services provided by Chapel Hill Transit, Duke Transit, Go Cary, Go Durham, Go Raleigh, Go Triangle, and Wolfline.
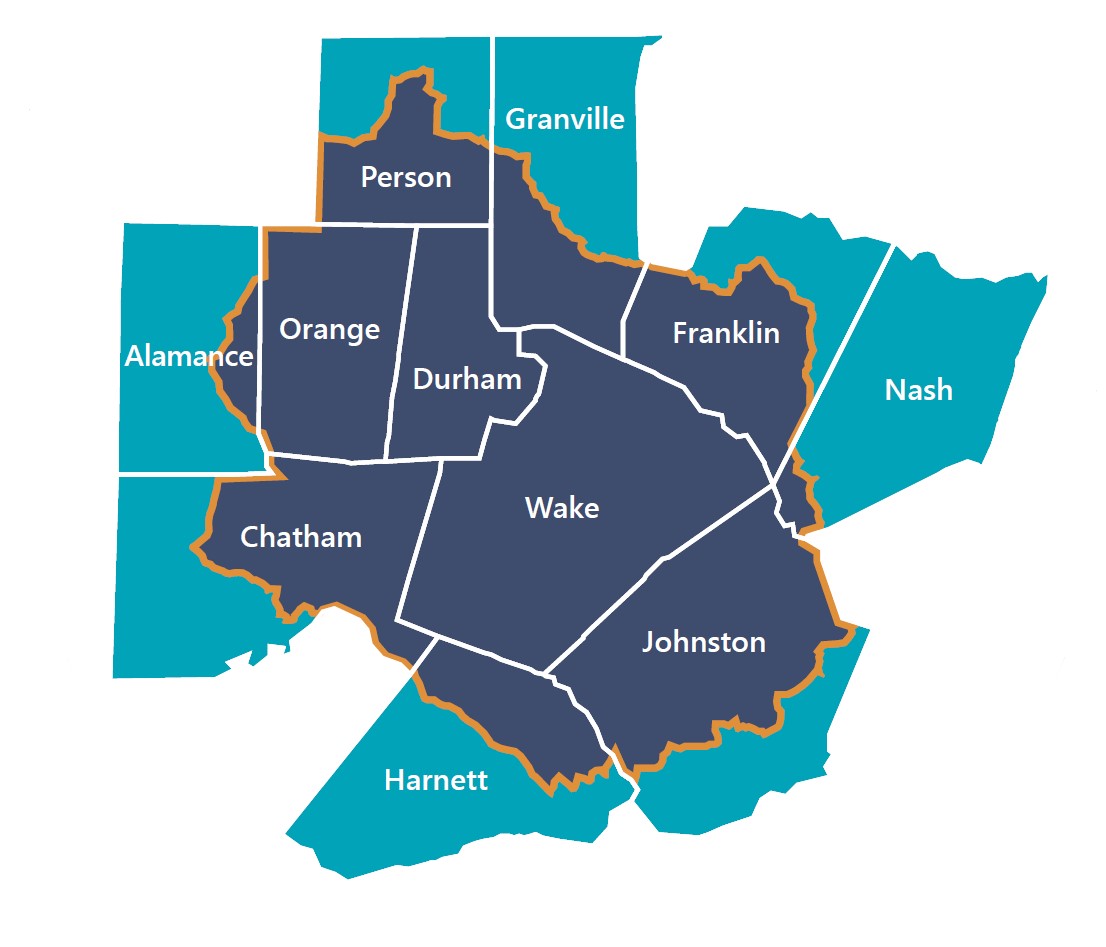
In addition to transportation supply, travel choices are also influenced by demographic and land activity data within each transportation analysis zone (TAZ). A TAZ is a geographic unit similar to a Census Block, though often bigger than a Census Block and smaller than a Census Block Group. The TAZs for the TRM cover all of Wake, Durham and Orange counties, and portions of Chatham, Franklin, Granville, Harnett, Johnston, Nash, and Person counties. This area covers 3,533 square miles, including all or part of 40 jurisdictions. The area is divided into 2,965 TAZs that include a total of 1,057,590 jobs and 2,001,649 people (pre-pandemic 2020). The modeled transportation system includes 16,368 miles of roadway and 121 transit routes operated by 10 transit systems.
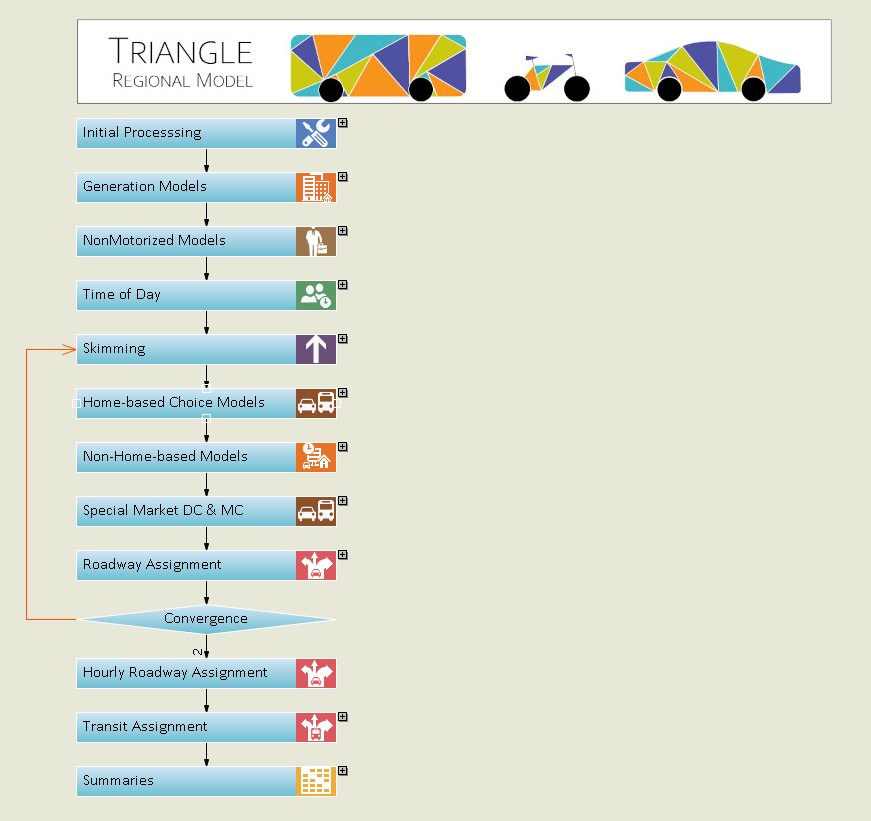
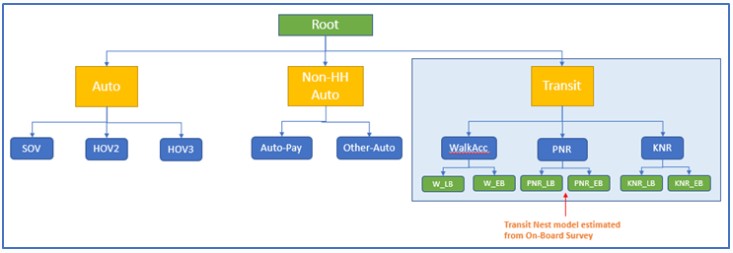
The travel demand resulting from travel choices is developed using a series of mathematical models that capture choices related to the number and types of trips people make, the mode they use to travel, the choice of destination, and the highway or transit routes used to reach that destination.
The TRM is the principal analytical tool used by transportation agencies in our region to develop and evaluate transportation strategies that support the mobility, accessibility, economic health and quality of life for the Triangle region.
Training and Outreach
TRM User Forum
The TRMSB administers a TRM User Forum intended to create a space where model users (consultants and agency staff) can share ideas and views related to the TRM. The benefits of a TRM Users Forum include:
- Improved customer service between the TRMSB and member agencies and/or the consultants that support their work program.
- Increased trust through enhanced transparency by providing a platform where members can share constructive suggestions and praise.
- Increased TRMSB program success through knowledge sharing and identification of resolutions to common problems.
- Driving model enhancement ideation though an open discussion of big ideas, next best things, and improved model features or capabilities.
- Removing barriers between the TRMSB and end users by providing a stronger presence in the Triangle modeling community.
The format of the User Forum varies from meeting to meeting, and may include elements such as panel discussions, lightning round presentations on modeling topics, a focused presentation around a small number of recent TRM applications along with lessons learned and suggested improvements, or a facilitated conversation around a specific question or topic.
To be added to the list of invitees, please send an email to ayoshiz@ncsu.edu.
Past Meetings
October 5, 2020
April 28, 2021
- Agenda Apr 2021
- Presentation Apr 2021
- TRMG2 Update Apr 2021
- Mapping Accessibility Presentation Apr 2021
- “Using the TRM to answer transportation-health questions” Presentation Apr 2021
- TRMG2 Update Overview Presentation Apr 2021
October 11, 2021
- Agenda Oct 2021
- Presentation Oct 2021
- TRMG2 Update Overview Presentation Oct 2021
- TRMG2 Tolls Presentation Oct 2021
April 6, 2022
October 5, 2022
March 12, 2023
November 1, 2023
MAY 15, 2024
November 18, 2024
APRIL 23, 2025
November 12, 2025
Upcoming Meetings
Spring 2026
TRM Data Tools and Analytics
The TRM Team uses available data and tools to describe travel and travel metrics in the Triangle region in a way that provides useful insights for informing the public and transportation planners, guiding future actions, or informing future decisions. This work may result in interactive data visualizations that are posted to the TRM Data Dashboard or in graphics driven fact sheets that are shared with sponsoring partners and the public through the TRM website.
Input Data
Triangle Travel Trends Analysis
1995 to 2016
2016 & 2018
2016, 2018 & 2021
COVID Pandemic Impacts – 2018 to 2021
Active Transportation
Transit
Triangle Travel Trends (visualization)
TRM Data Dashboard (visualization)
RSG TRB Presentation on Teleworking Trends (report)
Output Data
Travel for Communities of Concern
VMT and Delay Metrics (visualization)
Others
Contact
Alexander Yoshizumi
919-522-8839 | ayoshiz@ncsu.edu