About
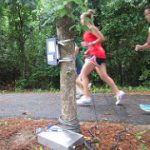
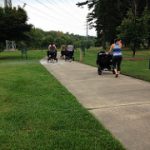
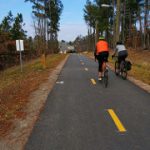
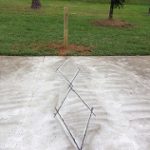
ITRE manages the North Carolina Non-Motorized Volume Data Program (NC NMVDP) for the North Carolina Department of Transportation (NCDOT). The NC NMVDP began as a research project to test a bicycle and pedestrian count protocol for replication across the state. The program currently includes one of the most extensive statewide networks of continuous bicycle and pedestrian counting sensors and provides data management and reporting support for multiple local agency partners. The bicycle and pedestrian counting systems are installed on sidewalks, bike lanes, shared lanes, and shared use paths across the state. The program is a team effort that involves cooperation and collaboration between local agency partners (municipalities and regional planning agencies), NCDOT, ITRE, and our counting technology vendor, Eco-Counter.
The data produced from this program can be used to evaluate facility usage over time, inform the project prioritization process, provide quantifiable evidence to support multi-modal Complete Streets policies, and improve municipal and regional active transportation planning. The data can be used in planning tools to measure existing patterns and model future trends at the site, corridor, and regional levels.
COVID-19 Impacts on Bicyclist and Pedestrian Activity in North Carolina
ITRE examined the impact of the COVID-19 pandemic on bicyclist and pedestrian activity in North Carolina by analyzing count data from the NC NMVDP.
Results from these analyses were shared in a presentation at the Another Way to Get from Here to There: NCDOT Integrated Mobility Division Innovation & Technology Webinar Series (video and slides).
An ArcGIS StoryMap is also available that highlights daily user volumes and hour of day patterns on trails in North Carolina during the COVID-19 pandemic from March through September 2020 and compares these to user volumes in previous years.
Analyses of bicyclist and pedestrian volumes between March and September 2020 showed that:
- Commuting trips decreased, while recreational trips increased compared to pre-2020 patterns.
- Both bicyclist and pedestrian volumes measured at downtown access points, business districts, and university commuting corridors decreased from pre-2020 volumes, while both bicyclist and pedestrian volumes measured along shared use paths (such as greenways and trails) increased from pre-2020 volumes.
- Pedestrian volumes along residential sidewalks increased from pre-2020 volumes.
The magnitude of these changes over time and whether each site will reach a new equilibrium point or return to pre-2020 volumes as society adjusts to the pandemic is an area of continued investigation.
ITRE presented the bicycle-specific findings from our analyses covering the period March through September 2020 at the 2021 National Bike Summit.
This presentation provides more details on the differences by facility and trip type, weekday vs. weekend, and hour of day for bicyclist activity.
ITRE recently updated the bicycle and pedestrian analyses using count data through February 2021.
These findings were shared in a presentation to NCDOT Integrated Mobility Division and their Bicycle and Pedestrian Stakeholder Group.
Quarterly Data Reports:
Beginning with 2020 Quarter 2 (Q2), quarterly data reports are provided publicly through the Eco-Visio web application. Previously, only local agency partners currently participating in the NC NMVDP were provided access to quarterly data reports, and only annual data reports were available to the public. We recognize the need for more timely access to verified count data collected by counters in the NC NMVDP. We will now be publishing quarterly data reports to our program webpage in addition to directly notifying local agency partners.
Quarterly data are counts that have been verified so that data resulting from known equipment malfunction are removed, but correction factors have not been applied to adjust the counts for systematic over or undercounting. These counts have been verified but not adjusted.
The 2021 Q3 dataset includes raw data that have been run through quality assurance and quality control (QA/QC) processes and scrubbed of invalid data. Special events and other “atypical days” are included in the reported data. This dataset covers the period from December 1, 2020 to August 31, 2021.
This dataset also includes counters that were not eligible for 2020 annual data reporting because they have not been in place for a full program year (December through November) and have not had their accuracy assessed through a reliable validation study. These counters include data from previous quarters in 2020.
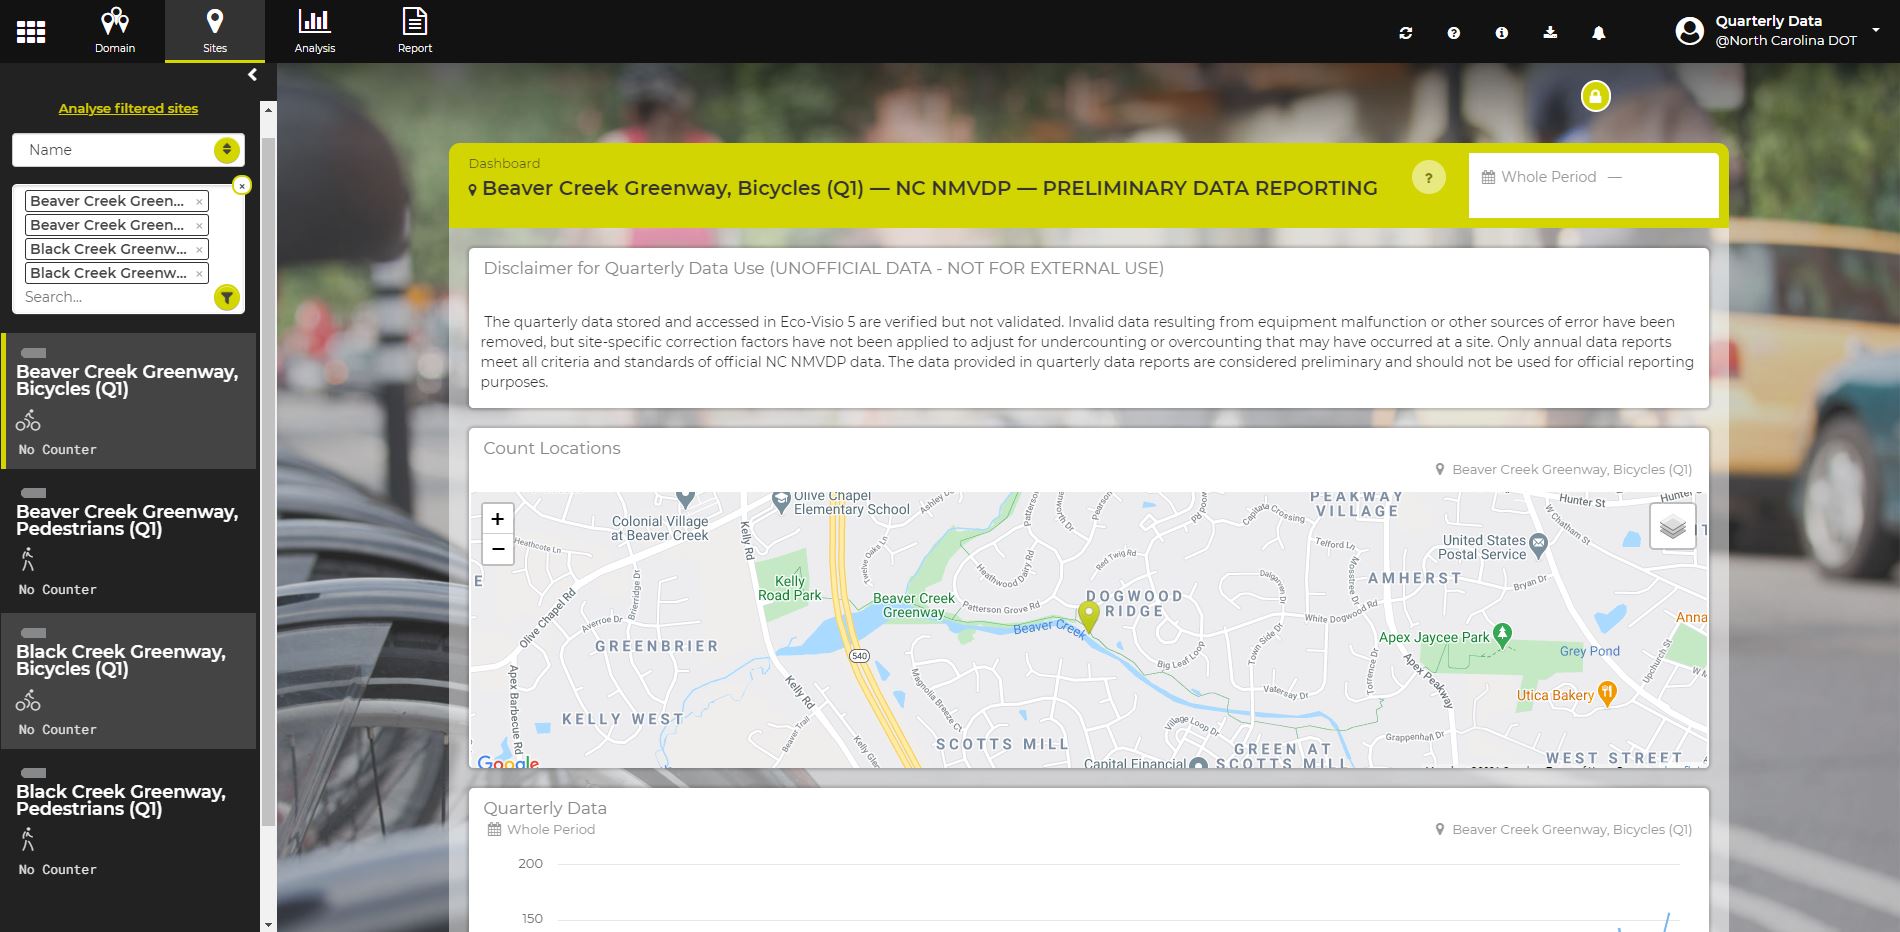
Please note that the counting sites displayed in the quarterly data reporting dashboard will include a “no counter” label. This is because there is no physical counter attached to these counting sites. If there were counters attached to the counting sites, it would mean the data on each counting site are raw data that have not been verified. Instead, the counting sites displayed in the quarterly data reporting dashboard are where all the data are stored that have been verified to ensure that the count data are as accurate as possible for preliminary reporting.
Disclaimer for Quarterly Data Use:
The quarterly data stored and accessed in Eco-Visio 5 are verified but not validated. Invalid data resulting from equipment malfunction or other sources of error have been removed, but site-specific correction factors have not been applied to adjust for undercounting or overcounting that may have occurred at a site. Only annual data reports meet all criteria and standards of official NC NMVDP data. The data provided in quarterly data reports are considered preliminary and should not be used for official reporting purposes.
To access the dashboards, please follow these steps:
Step 1:
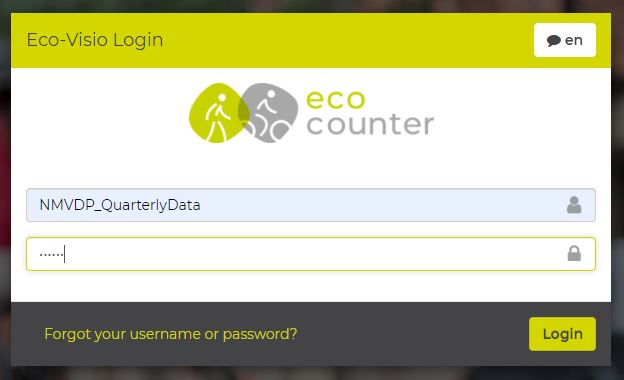
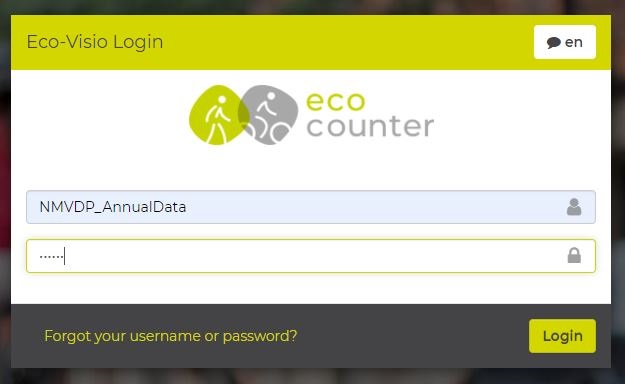
Log into Eco-Visio using the following credentials:
Username: NMVDP_QuarterlyData
Password: NMVDP_QuarterlyData_Public
Step 2:
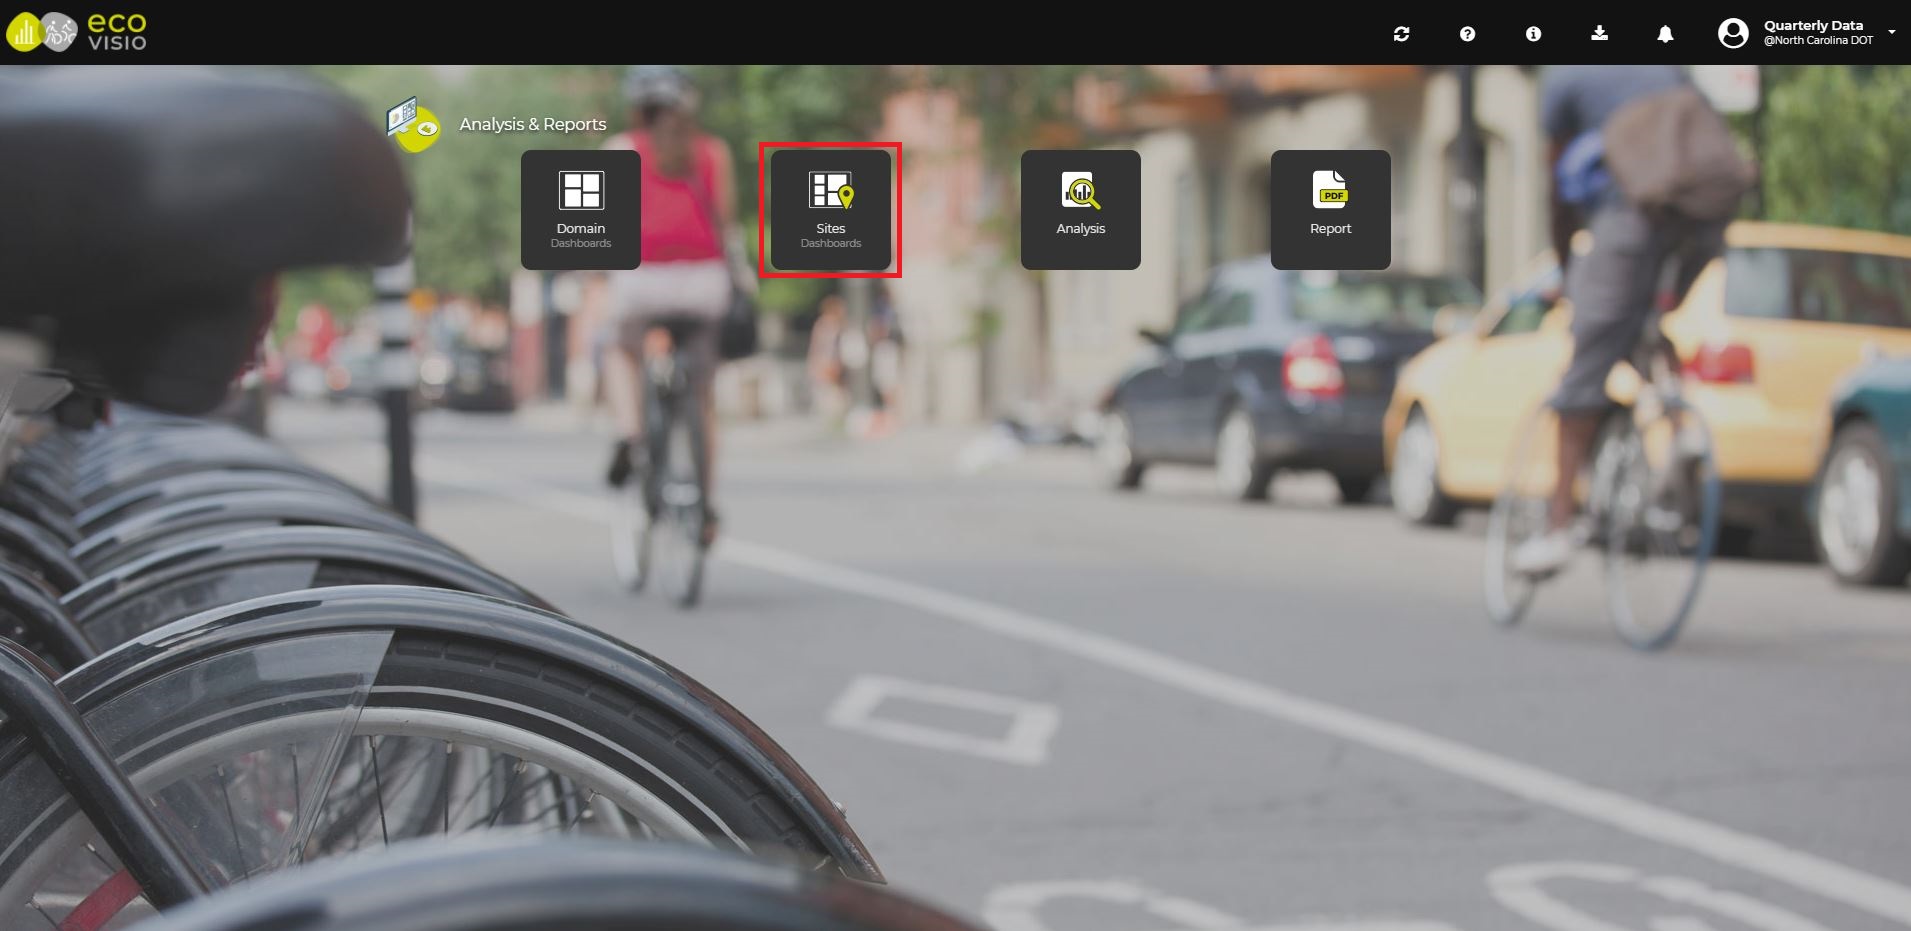
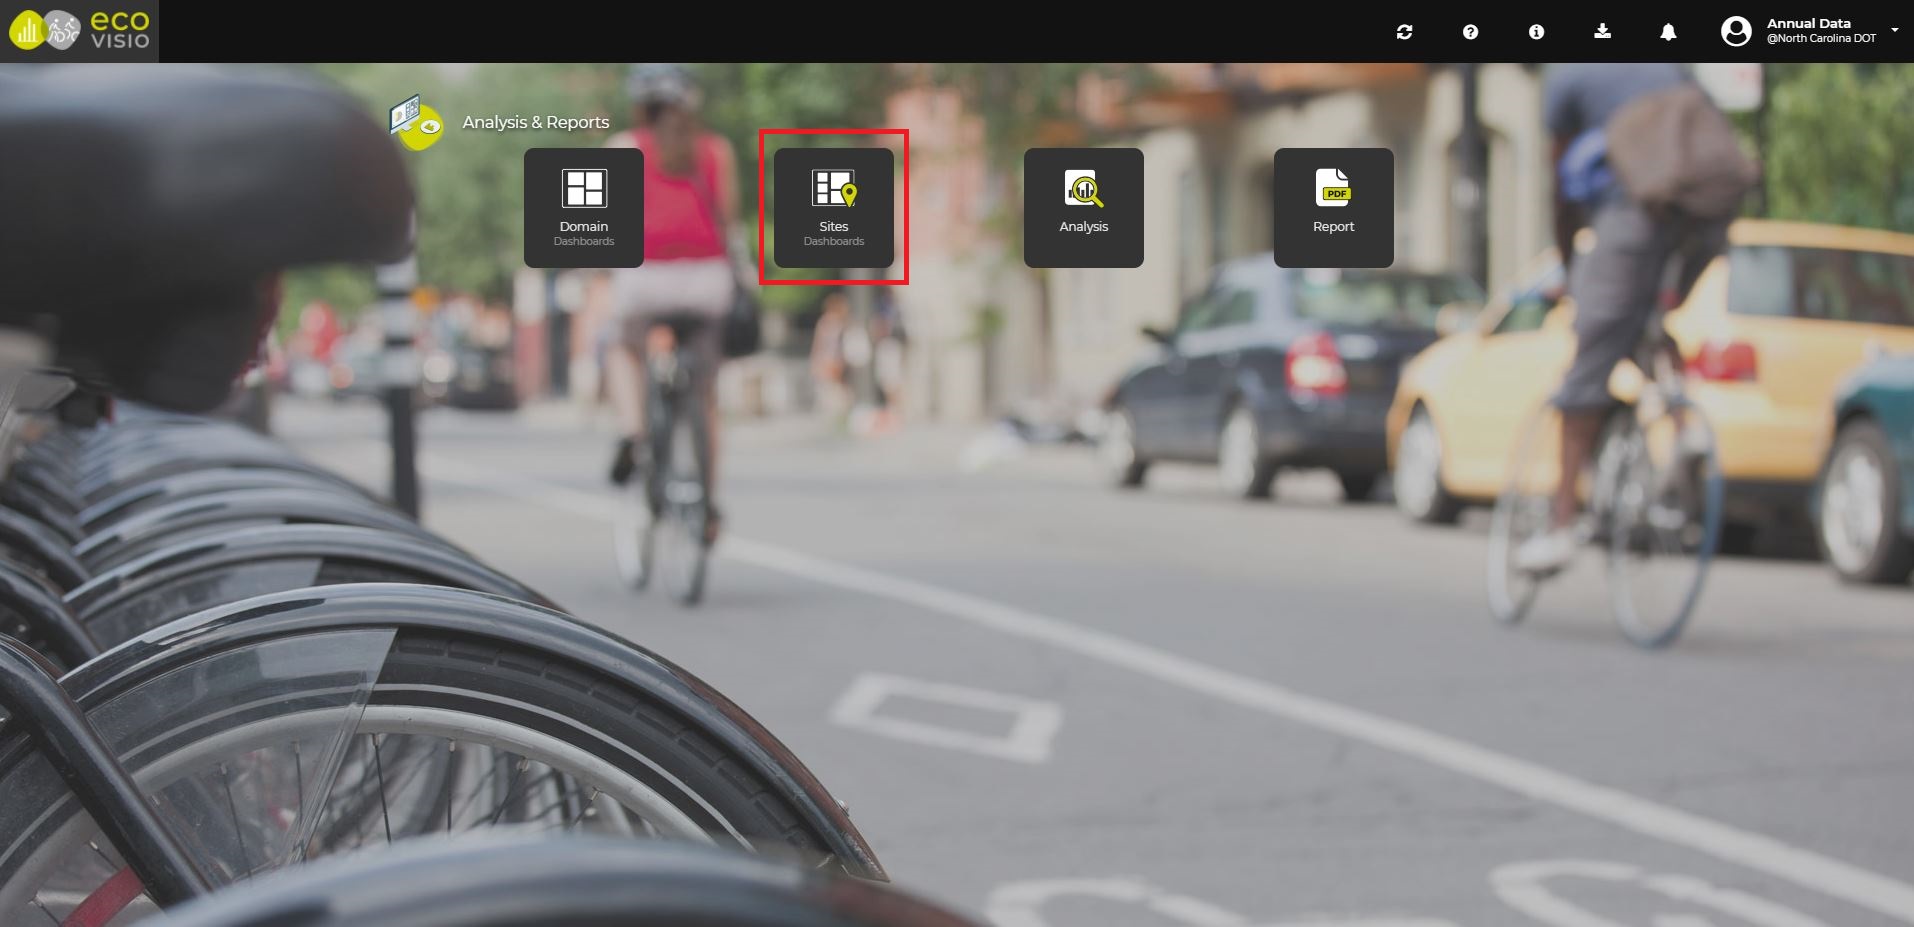
Click Sites Dashboards to access the dashboards for each counting location by mode included in the NC NMVDP.
Step 3a:
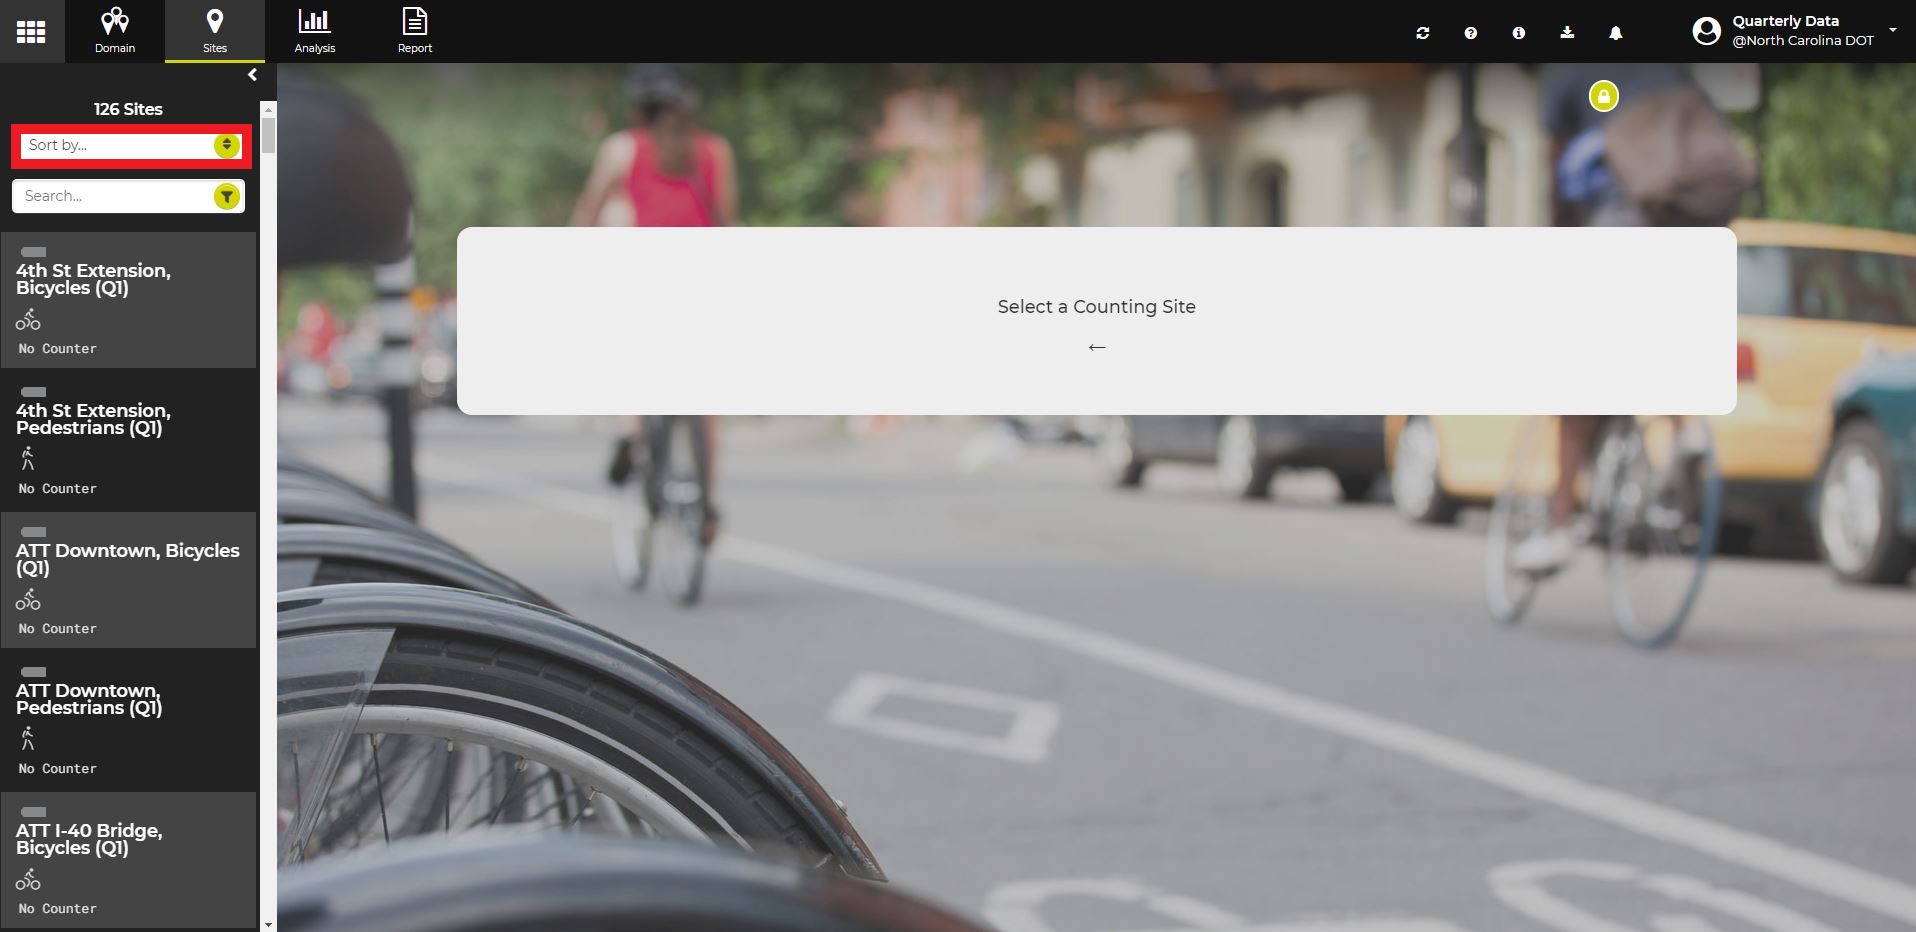
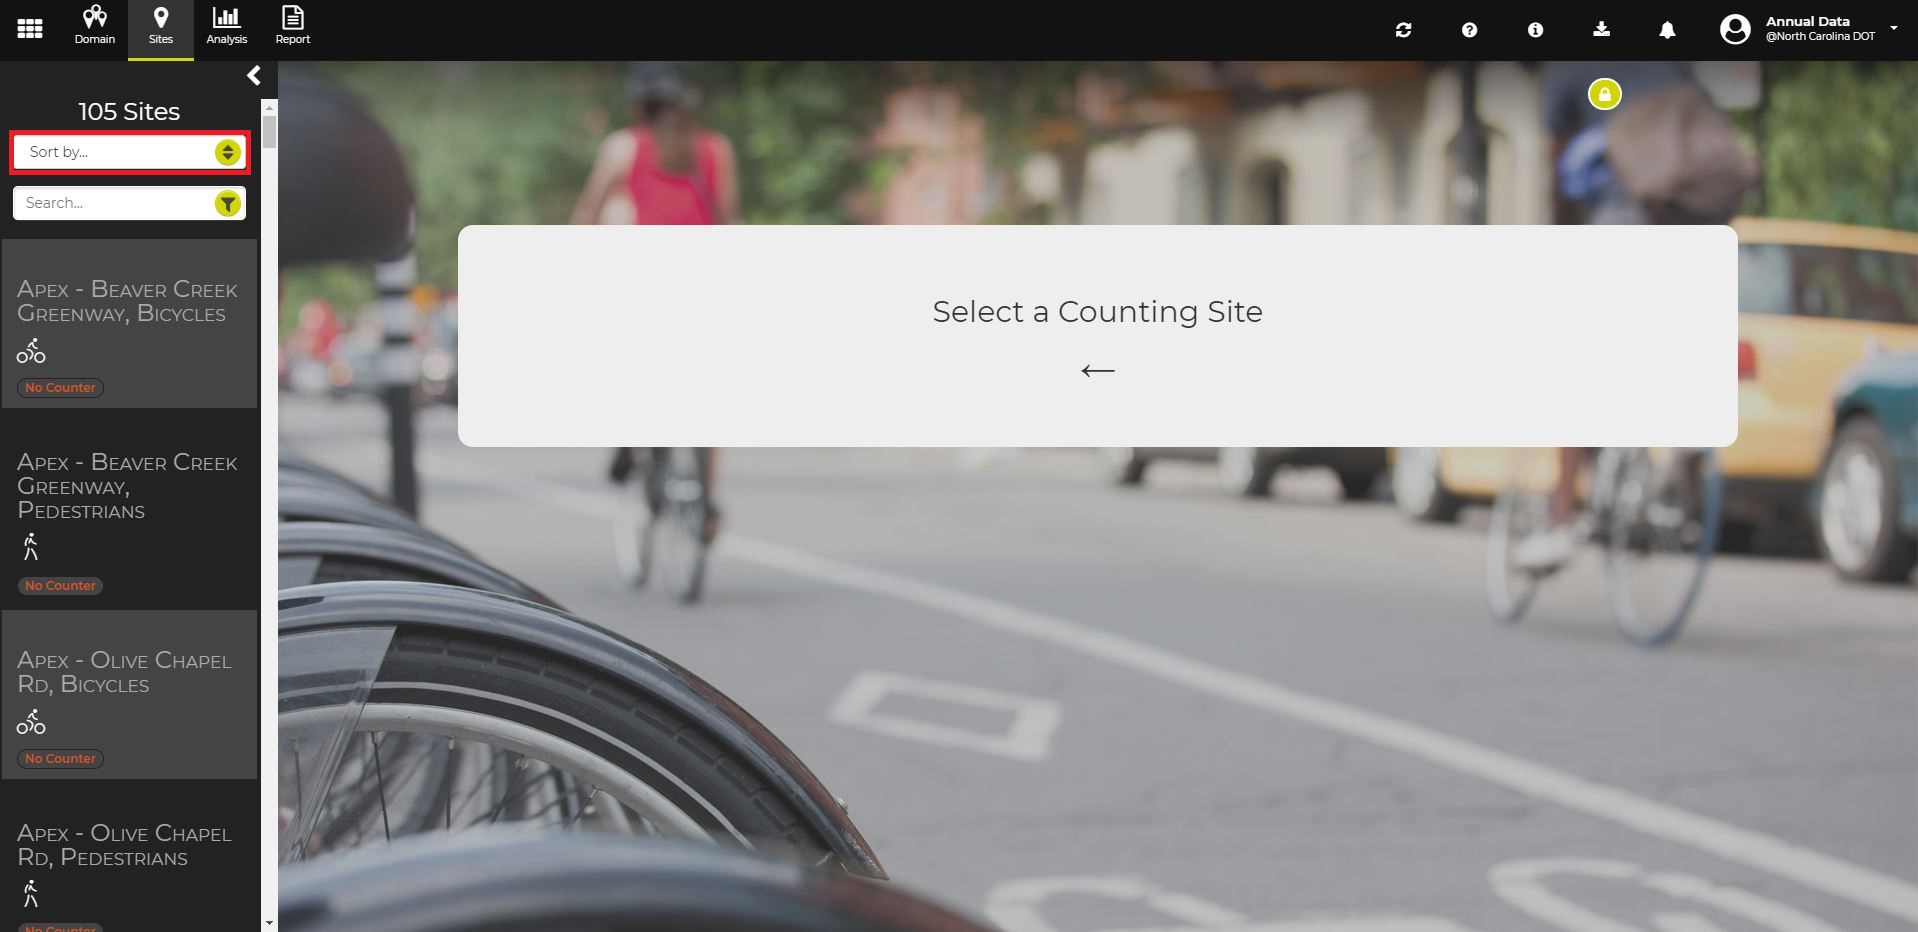
Select Sort by… Name located in the upper left corner of the screen beneath the 126 Sites title to sort the sites alphabetically.
Step 3b:
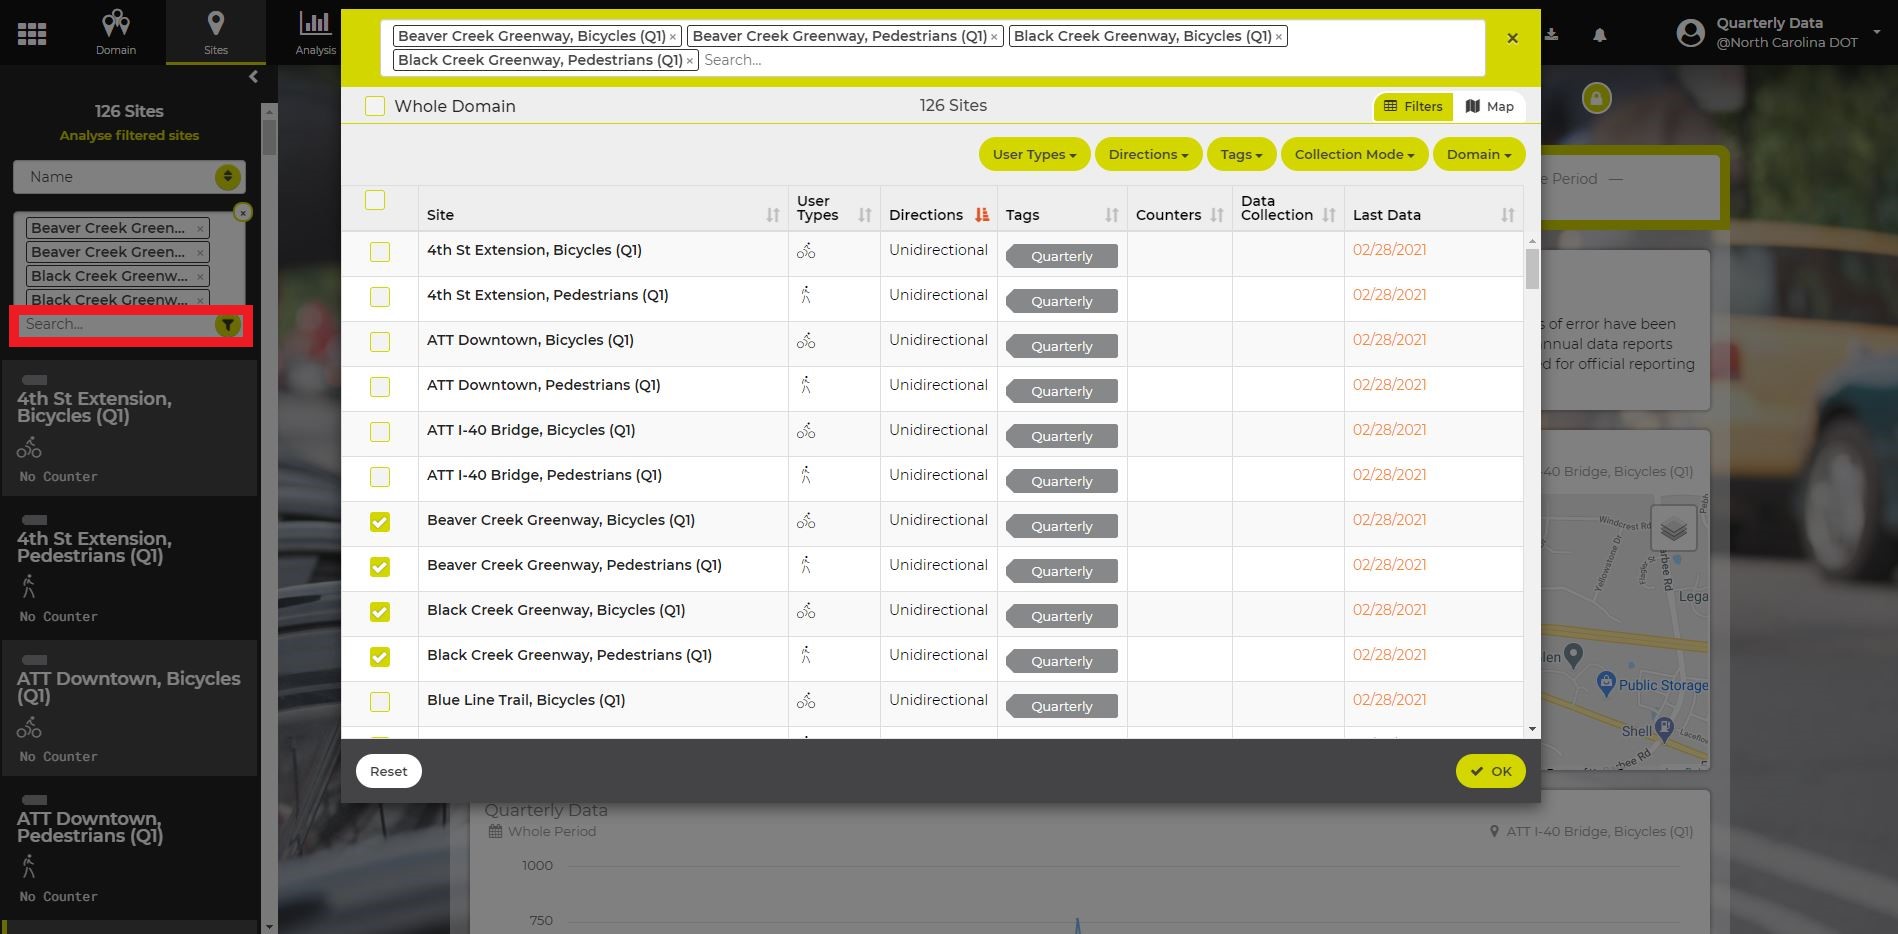
Select Search located in the upper left corner of the screen beneath the 126 Sites title to filter the sites by Facility and Mode.
Step 3c:
Click a counting location by mode from the left menu bar to display its quarterly data report.
Annual Data Reports: 2015-2020
Annual data are provided for counters that have been in place for a full program year (December through November) and that have had their accuracy assessed through a validation study. Based on the application of quality control, quality assurance, and validation procedures, invalid data have been removed from the dataset and correction factors have been applied. Documentation of data issues and their descriptions that led to the removal of data at specific counting locations are included for reference here.
Annual data are screenline counts by mode for each counting location. Annual data are reported through vendor-provided software, Eco-Visio 5, using a dashboard system. All available historic annual data for a given counter by mode are provided. Data are provided through November 30th, 2020.
Data for counters that were not eligible for 2020 annual data reporting because they have not been in place for a full program year (December through November) and have not had their accuracy assessed through a reliable validation study are provided in the 2020 Q4 data reports that can be accessed from the previous section.
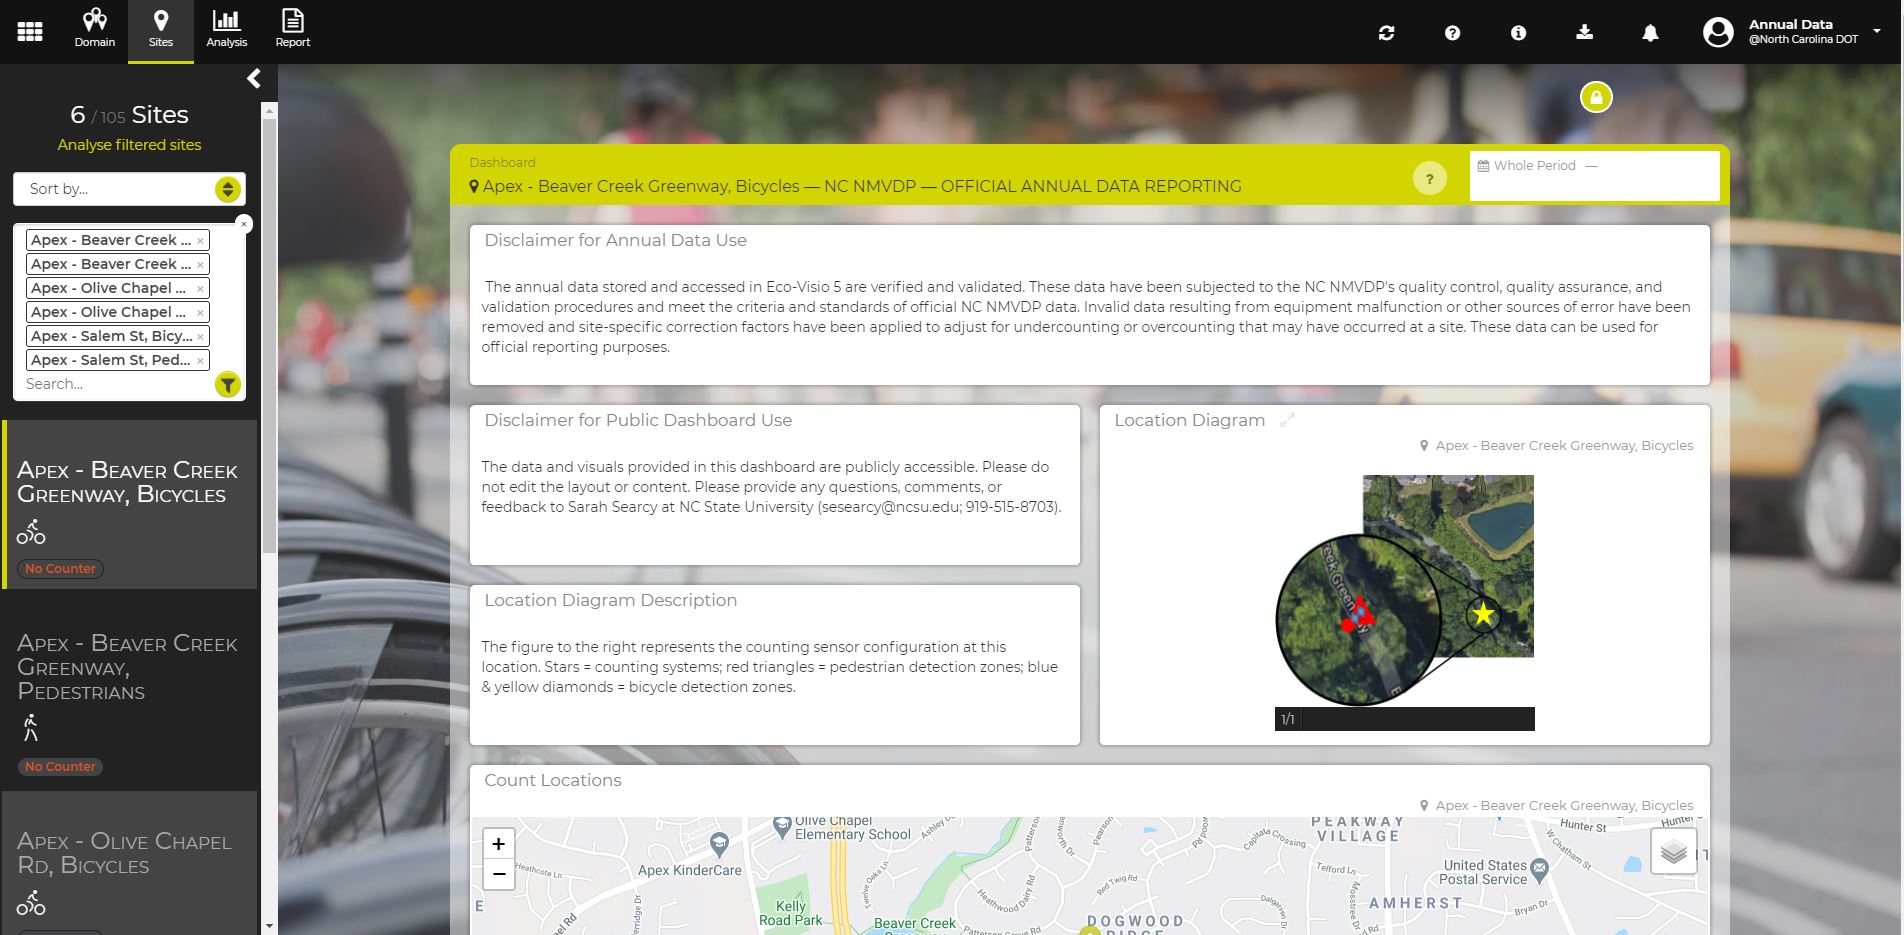
Please note that the counting sites displayed in the annual data reporting dashboard will include a “no counter” label. This is because there is no physical counter attached to these counting sites. If there were counters attached to the counting sites, it would mean the data on each counting site are raw data that have not been verified. Instead, the counting sites displayed in the annual data reporting dashboard are where all the data are stored that have been processed through the NC NMVDP QA/QC and validation procedures to ensure that the count data are as accurate as possible for official data reporting.
Disclaimer for Annual Data Use:
The annual data stored and accessed in Eco-Visio 5 are verified and validated. These data have been subjected to the NC NMVDP’s quality control, quality assurance, and validation procedures and meet the criteria and standards of official NC NMVDP data. Invalid data resulting from equipment malfunction or other sources of error have been removed and site-specific correction factors have been applied to adjust for undercounting or overcounting that may have occurred at a site. These data can be used for official reporting purposes.
To access the dashboards, please follow these steps:
Step 1:
Log into Eco-Visio using the following credentials:
Username: NMVDP_AnnualData
Password: NMVDP_AnnualData_
Step 2:
Click Sites Dashboards to access the dashboards for each counting location by mode included in the annual data reporting.
Step 3a:
Select Sort by… Name located in the upper left corner of the screen beneath the 105 Sites title to sort the sites alphabetically.
Step 3b:
Select Search located in the upper left corner of the screen beneath the 105 Sites title to filter the sites by municipality and mode.
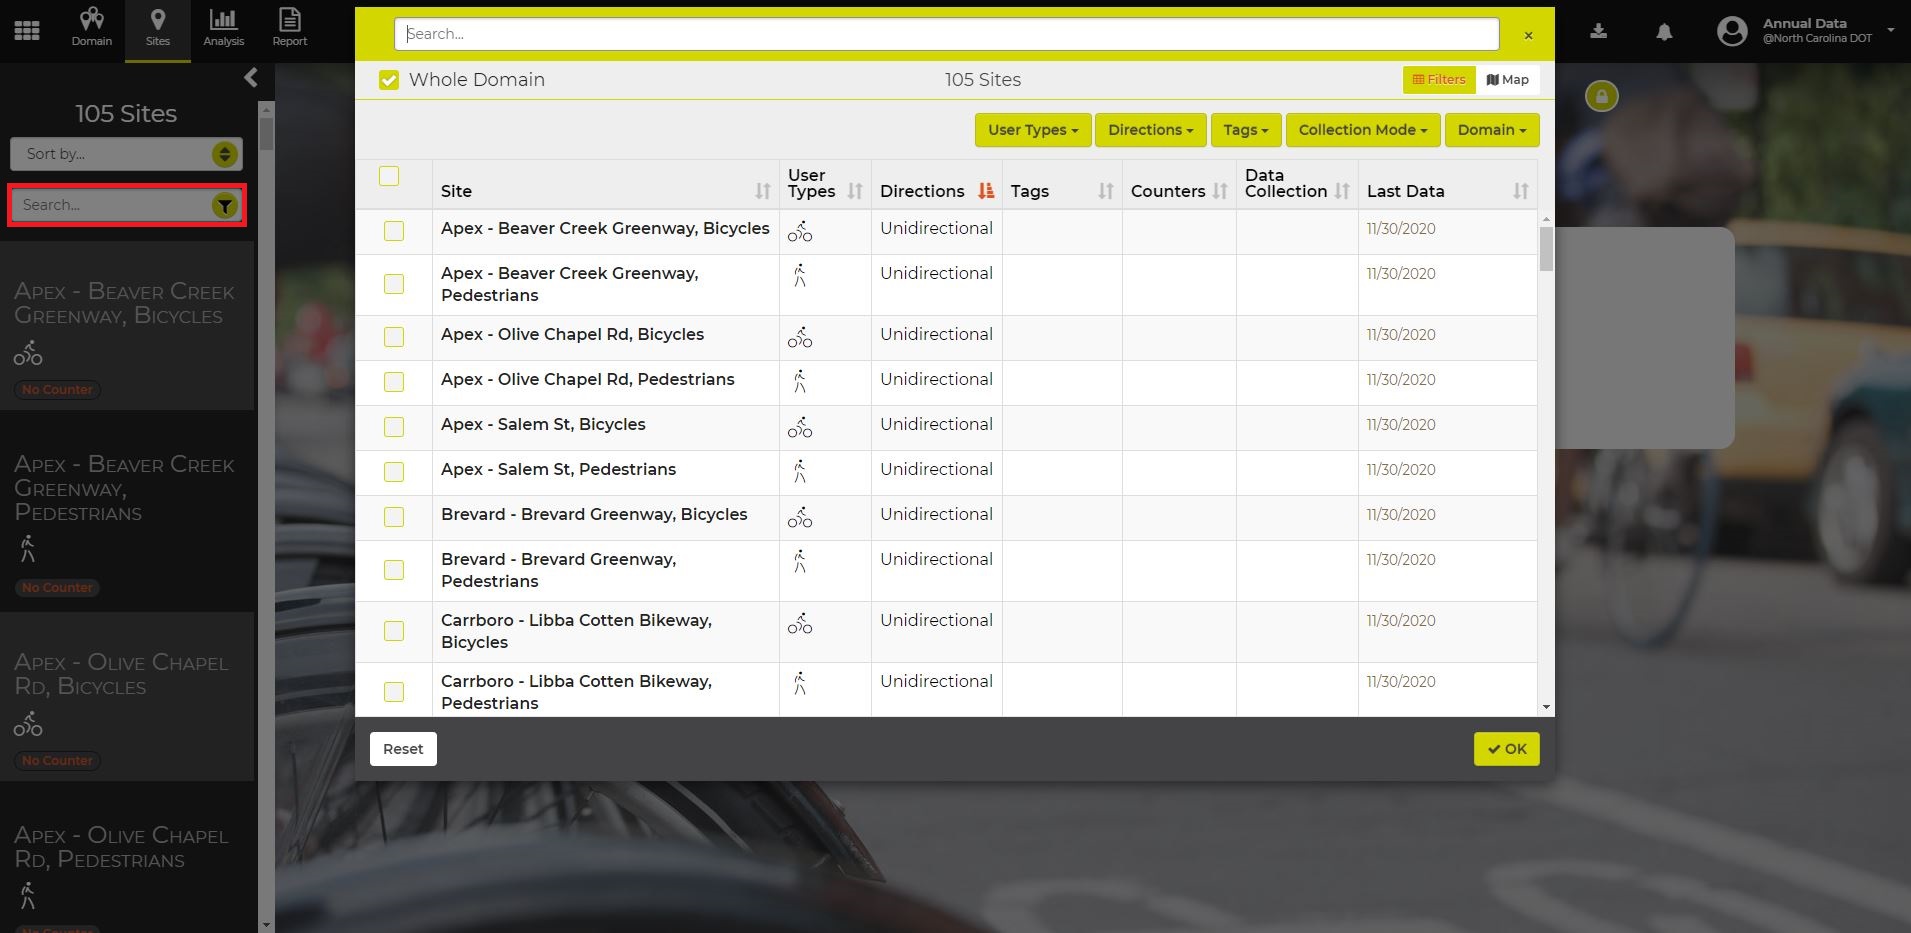
Step 3c:
Click a counting location by mode from the left menu bar to display its annual data report. All available historic annual data for a given counter by mode are provided.
Program History
2014-2015: Phase I, Pilot
The pilot phase of the NC Non-Motorized Volume Data Program was conducted in NCDOT Divisions 7 and 9 (the Piedmont Triad region) to test a bicycle and pedestrian count protocol and replicate the methodology across the state. Twelve continuous count stations began monitoring bicyclist and pedestrian travel in late 2014. These stations cover a mix of sites across different land uses, travel patterns, and volume groups. Detailed technical information can be found in the Phase I Final Report and Appendices. The following programmatic elements were piloted:
- Agency Coordination
- Site Selection and Procurement
- Equipment Installation and Onboarding
- Equipment Validation
- Data Handling, Monitoring and Management
- Equipment Maintenance
- Data Reporting
Documentation
- Phase I Final Report [PDF]
- QA/QC Workflow Poster (Presented at 2016 NATMEC) [PDF]
- “Establishing NC’s Non-Motorized Volume Data Program” Webinar Opens in new window
- Topics covered include the purpose of counting bicyclists and pedestrians, current state of practice, site selection, local agency partnerships, and data management.
- 2015 Continuous Count Station Site Overview and Data Summary [PDF]
2015-2016: Phase II, Expansion
Phase II of the project started in 2015 with expansion to NCDOT Divisions 4, 5, 8 and 10. Two additional shared use path sites in Brevard and Duck were installed in 2015 and continuous count stations were installed on roadways, sidewalks, and shared use path in Charlotte in 2016.
Documentation
2016-2017: Phase II Continues
Phase II continued through 2017 with installations in NCDOT Divisions 4, 5, 8, and 10. Supplier issues resulted in lost data and the need to replace some systems. Stations where significant data were lost (greater than 90 days) are noted in the data report.
Documentation
2017-2018: Phase II Continues, Data Reporting Updates Begin
Phase II installations in the CAMPO region were completed in Summer 2018. Efforts began to refine data handling processes including transitioning to a semi-automated system for data quality assurance & quality control and moving data reporting to an online dashboard system rather than spreadsheet files.
For the first time, annual datasets were provided through Eco-Visio 5 using its dashboard system. This system allows users to download tabular data, map counter locations, and analyze data using charts & graphs. This system allows users to access verified and validated data in a timely manner and in an accessible format. Historic annual datasets were transitioned to the Eco-Visio 5 system in early 2020 and made public with the release of the 2019 annual data report.
2018-2019: Phase II Continues, Program Evaluation Begins
In Spring 2019, ITRE began evaluating the NC NMVDP as the program entered its sixth year. This included gathering feedback from agency partners on all aspects of the program, including agency coordination and agreement execution; site selection, installation, and maintenance of the counters; and data processing, analysis, and reporting. The program evaluation concluded in February 2020.
2019-2020: Phase II Closes, Transition to Collaborative Agency Model
Phase II officially closed in October 2020. Agencies that joined the NC NMVDP under Phase I or II transitioned to the Collaborative Agency Model. This means that NCDOT will support data monitoring and management for the useful life of the counting equipment based on the processes and procedures established under the NC NMVDP. ITRE is contracted to provide the data monitoring and management support, including routine quarterly and annual data quality assurance and quality control (QA/QC), equipment validation, and data reporting. This scope includes limited support for field maintenance and troubleshooting. Agencies that have purchased and installed counters separately from Phase I or II can join the program under the Collaborative Agency Model by opting into the data management scope of work. The verified and validated data collected by all counters in the program will continue to be made available to the public through the reporting dashboard on the program webpage.
The Phase II Final Report builds on the results of the pilot project initiated under Phase I and shares the updates to the protocols that were designed and tested through the pilot and further implemented through Phase II expansion of the NC NMVDP. Results from the program evaluation are also provided in the report.
Documentation
Resources for Local Agency Partners
Additional Resources
 Loading...
Loading...
Loading...
Loading...
Loading...
Loading...
Loading...
Contact
NC NMVDP Staff
- Program Manager & Local Agency Coordinator: Waugh Wright | (215) 715-8549
- Equipment Coordinator: Craig Baird | (919) 515-8041
- Validation Lead: Chris Carnes
- Data Processing Lead: Brendan Kearns