Integrated Planning for School and Community
Integrated Planning for School and Community (IPSAC) is a suite of tools and practices designed to assist decision makers in the school planning process. IPSAC is a product of the Operations Research and Education Laboratory, located at the Institute for Transportation Research and Education on Centennial Campus at North Carolina State University. IPSAC was a 1998 Edelman Prize Winner, awarded by the International Forum of Operations Research and Management Science (INFORMS), the world’s leading professional association of operations researchers and management scientists. The planning system has been featured in numerous professional journals, newspapers, and media broadcasts.
Some of the components of IPSAC are:
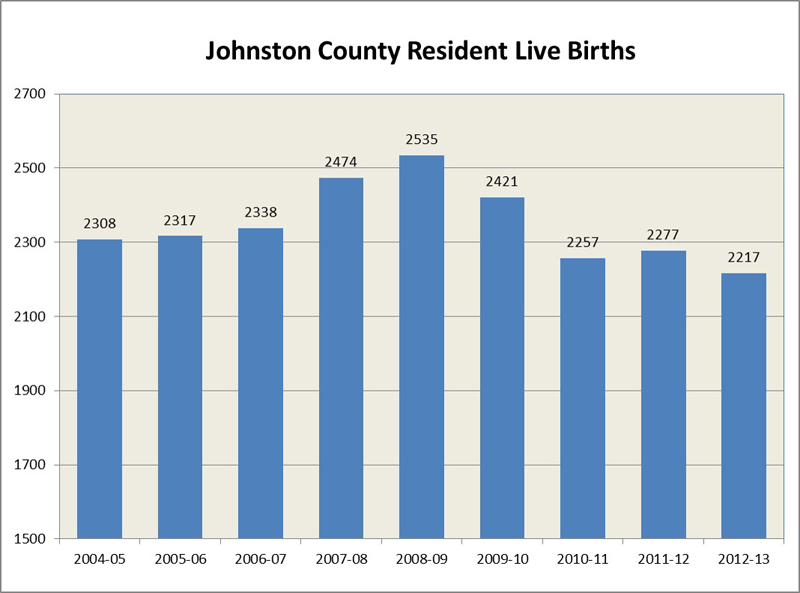
Data and Trends
Historic data plays a vital role in understanding growth in a school district. Analysis of demographic trends can provide insight into future growth patterns and potentials.
Land Use Study
While the analysis of historical trends is an important part of any comprehensive study, the IPSAC Land Use Study conducted by OREd provides a forward-looking data-driven view of a school district’s growth potential.
A comprehensive Land Use Study of the school district quantifies future growth by school attendance zones. The Land Use Study typically includes two components: community interviews and geographic information systems (GIS) analysis.
The purpose of the community interviews is to capture stakeholders’ knowledge and perceptions of key trend indicators, factors encouraging growth, factors constraining growth, and transportation and water/sewer issues that may impact residential and non-residential developments. A critical task of the community interviews is to locate and identify all new and planned residential subdivisions.
A spatial analysis based on geographic information systems (GIS) parcel data provides quantitative data concerning available parcels and subdivisions lots that can be used to identify areas of future growth. Student demographic analysis can also be conducted at this stage to better understand socioeconomic components that may influence school assignment decisions.
GIS Analysis
Geographic Information Systems, or GIS, are technologies that allow users to explore the merger of spatial data (like a network of streets) to tabular data (such as a database of K-12 students). GIS software also includes tools for the analysis of individual data layers and the relationships between multiple data layers. The evolution of GIS technology has paralleled the development of IPSAC and propelled the advancement of new techniques for forecasting land use and future impact to school districts.
The central feature of GIS analysis for IPSAC is the planning segment. Planning segments are geographic areas that are the fundamental units of analysis in IPSAC. GIS software allows OREd to divide a school district into planning segments that can hold student information, parcel tax information, land use data, zoning, and more. The planning segments are also the building blocks for the optimization components in IPSAC.
Planning segments are created to:
- preserve existing school boundaries,
- contain households of the same residential type when possible,
- contain 50-100 K-12 students when possible,
- consider accessibility/transportation issues when possible,
- anticipate future development, and
- preserve man-made and natural boundaries.
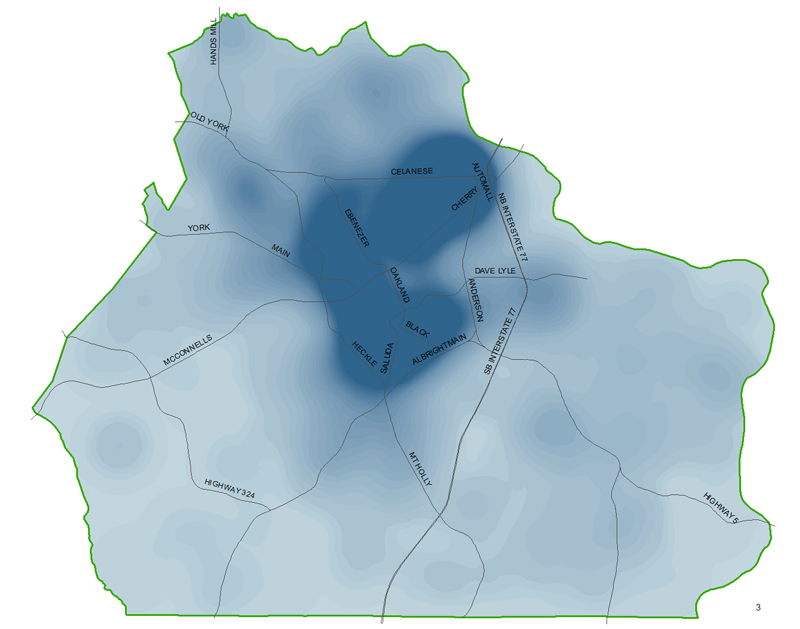
Historic Student Population Growth maps
These maps show how the student population of the school system has changed over time. Red shows growing areas which are producing more students now than in previous years. These could be new subdivisions, new apartments, or existing residential areas with increasing numbers of school-aged children. The darker the red, the more concentrated the student population growth. Blue on the other hand indicates declining student populations; typically where students are aging out of the system.
These Historical maps give a snapshot of when and where growth has occurred and which schools have likely been impacted. These maps are available as static images or video animations.
Student Population Potential Growth Maps
Future Growth maps show hotspots of where student populations are likely to increase. These maps display official OREd IPSAC predictions which take into account demographic and economic trends, existing neighborhood characteristics, new developments, potential developments, and other data.
These maps indicate where additional students are likely appear in the next several years. This gives decision makers a heads-up in terms of exactly where large scale population and economic trends will affect schools the most.
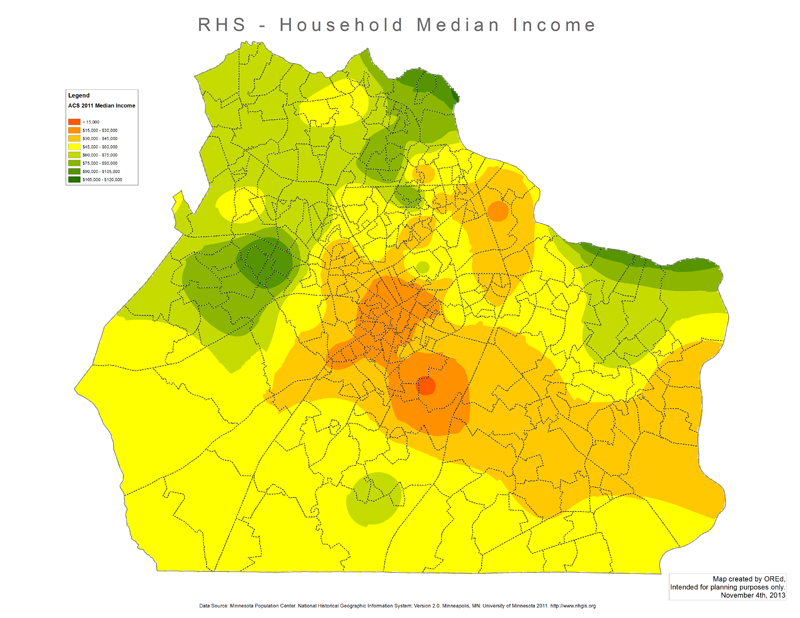
Median Income Census Maps
Income maps estimate household median income for all locations within a district. These estimates are based on the most recently available data from the US Census American Community Survey (ACS). When creating assignment plans, maps like these can help provide fairness and balance between schools.
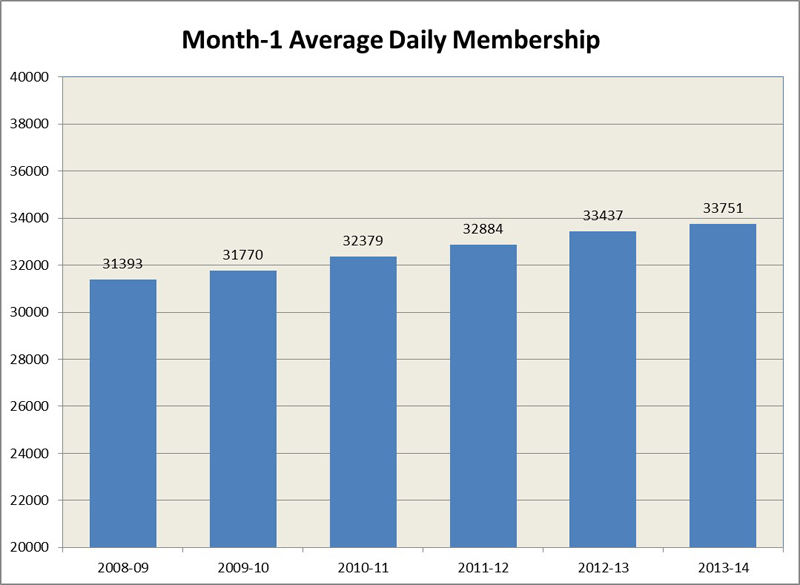
Membership Forecast
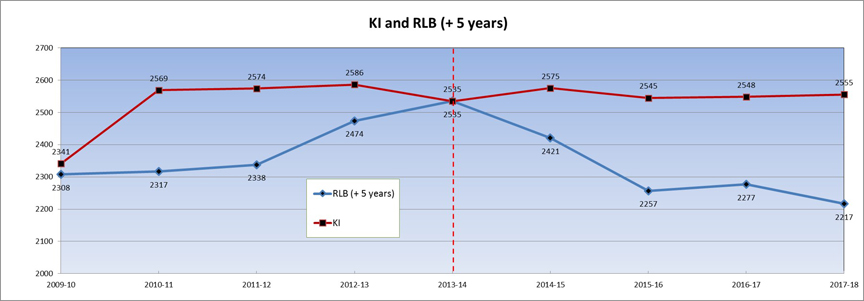
Integrated Planning for School and Community (IPSAC) used by the Operations Research and Education Lab (OREd) recognizes that the central feature in almost every study is a system-wide K-12 membership forecast. Using standard cohort techniques along with optimal trend-matching tools, OREd can produce short to long-range enrollment forecasts for the entire school district.
OREd selects the forecasting model most appropriate for the District.
Incorporating historical school membership figures and available newborn data for the school district, OREd uses a variety of cohort survival models to project system level and/or school-level membership. OREd’s forecast method does not rely on an arbitrary choice of years or weights. Instead, it undertakes an empirical search on the membership history of each school district to determine the optimal forecast model.
Models may also be created using a GIS-based analysis that includes a geocoded student layer and a parcel layer. Information from a Land-Use-Study (LUS) may also be incorporated to forecast the location of students entering the system because of new residential development.
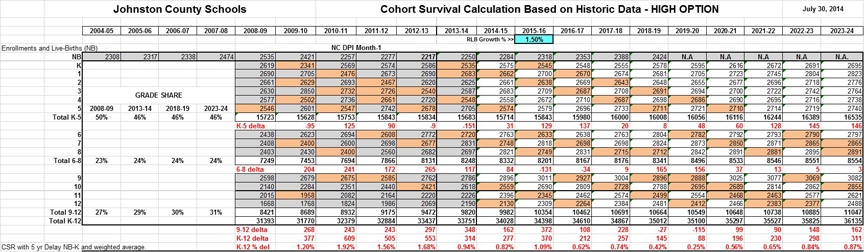
The Out-of-Capacity Table
The synthesis of historical trend analyses and a Land Use Study is a high-resolution forecast of student population. Incorporating state-of-the-art Geographic Information Systems (GIS) tools into proven statistical methods, OREd can provide a school district with a building-by-building membership forecast known as the Out-of-Capacity Table(OOC). The OOC is a powerful tool used by school district facility experts to develop long-range school facility plans.
The OOC may be examined by school, by level, or as a whole. While the quantitative information is important and accurate to the degree any forecast can be, the OOC is color-coded, according to building utilization. The colors, red for over-utilized, provides an easy assessment of where the critical areas may be.
Optimal School Sites
The high-resolution student population forecast allows OREd to use Operations Research techniques to determine optimal sites for new schools.
Optimal siting for new schools can be especially important for growing districts and those about to seek voter approval for school construction funds. OREd constructs school site scenarios by minimizing student travel distance while maintaining all other school board policies pertaining to constraints such as school capacity, demographic balance, and grade structure.
The outcome for this IPSAC component is a set of maps and data known as scenarios with the optimal target sites for new schools that is in concert with forecasted capacity demands and that satisfies the school system’s policies.
The output from OREd’s GAMS software may also provide optimal scenarios that do not include new schools sites. Optimal scenarios may guide districts in decisions about re-aligning school attendance zones.
Optimal School Attendance Zones
A parallel process in the determination of optimal school sites is the creation of optimal attendance zone scenarios that minimize system-wide transportation costs while satisfying policy-based criteria that include: building capacities, demographic balance, and socioeconomic and academic criteria.
Many school districts periodically face the challenge of developing attendance zones for existing schools or already have proposed building sites and are concerned with new attendance zones. OREd uses a sophisticated Operations Research algorithm (GAMS) to construct optimal scenarios that explore the impact of various constraints such as school demographics, building utilization, or student academic achievement. These optimal attendance zone scenarios are mathematically sound platforms that can be used by school districts to refine school assignment objectives and todefend assignment plan recommendations.
“What if” Attendance Zone Scenarios
While the optimal attendance scenarios generated in the optimization component of IPSAC may satisfy specific school board policies, there are always realities that must be considered that often cannot be formulated in the optimization model. OREd has developed tools that enable school districts to explore “what if” attendance zone scenarios that address specific student assignment issues.
In most cases, few attendance zone scenarios survive as potential school assignment plans after rigorous testing of optimization constraints. Understanding that student assignment plans often impact communities in ways that cannot be included in the model, OREd customizes a Scenario Builder tool that allows school districts to modify optimal assignment scenarios and simulate “what if” attendance zones.
OREd Client Districts
- Alamance-Burlington School System – 02, 03, 06, 07, 08, 09, 10, 11, 12, 13
- Asheboro City Schools – 04, 05, 06, 07
- Berkeley County Schools (SC) – 09, 10, 11, 12
- Bladen County Schools – 04
- Buncombe County Schools – 98, 99
- Brunswick County Schools – 03, 04
- Cabarrus County Schools – 12, 14
- Carteret County Public Schools – 09, 15
- Chapel Hill-Carrboro Schools – 95, 96, 97, 98, 99, 00, 01, 02, 05, 06, 07, 12
- Chatham County Schools – 03, 05, 06, 07, 08, 09, 10, 11, 12, 13, 15, 16, 17, 18
- Craven County Schools – 96, 97, 98, 99, 00, 01, 02, 04, 05, 06, 07, 08, 12, 14
- Cumberland County Schools – 08, 09
- Cleveland County Schools – 08
- Currituck County Schools – 09, 10
- Duplin County Schools – 08, 09
- Durham Public Schools – 08, 09, 10, 11, 12, 18
- Edgecombe County Public Schools – 09
- Elizabeth City-Pasquotank County Schools – 07
- Florence County School District 1 (SC) – 15
- Franklin County Schools – 08, 11, 12, 18
- Gaston County Schools – 98, 99, 00, 01, 02, 03, 04
- Granville County Schools – 02, 03, 04, 05, 06, 07, 08, 09, 10, 17
- Guilford County Schools – 94, 95, 96, 97, 98, 09, 10, 11, 13, 14, 15
- Harnett County Schools – 98, 99, 00, 01, 02, 03, 06, 07, 08, 09, 10, 11, 12, 13, 14, 15, 16, 17, 18
- Haywood County Schools – 99
- Hoke County Schools – 99, 08, 09, 11, 12
- Iredell-Statesville Schools – 98, 99, 00, 01, 02, 03, 04
- Johnston County Schools – 94, 95, 96, 97, 98, 99, 00, 01, 02, 03, 04, 05, 06, 07, 08, 09, 10, 11, 12, 13, 14, 15, 16, 17, 18
- Jones County Schools – 08
- Lee County Schools – 08, 09
- Lenoir County School – 09
- Moore County Schools – 04, 06, 07, 08, 12, 13, 14, 15, 16, 17
- Mooresville Graded Schools – 99, 00, 01, 04
- Nash-Rocky Mount Schools – 04, 05, 06, 07, 08, 09, 10, 11, 12, 18
- New Hanover County Schools – 95, 96, 97, 98, 99, 00
- Onslow County Schools – 03, 04, 05, 06, 07, 08, 09, 10, 11, 12, 13, 14, 15, 16, 17, 18
- Orange County Schools – 95, 09, 10, 11, 13, 17, 18
- Pamlico County Schools – 09
- Pender County Schools – 13 , 14, 15
- Randolph County Schools – 05, 06, 07, 08, 09
- Richmond County Schools – 00, 08
- Robeson County Schools – 08
- Rock Hill Schools (SC) – 02, 03, 04, 05, 06, 07, 08, 09, 10, 11, 12, 13, 15
- Rowan County Schools – 09, 14, 15
- Pitt County Schools – 90, 91, 92, 93, 94, 95, 96, 97, 98, 99, 00, 01, 02, 03, 04, 05, 06, 07, 08, 09, 10, 11, 12, 13, 17
- Stafford County Public Schools (VA) – 12, 14, 15
- Stanly County Schools – 12
- Stokes County Schools – 05, 06, 08
- Transylvania County Schools – 14
- Tupelo Public Schools (MS) – 07
- Union County Schools – 99, 00, 01, 02, 03, 04, 05, 06, 07
- Vance County Schools – 09
- Wayne County Schools – 95
- Wake County Public School System – 97, 04, 05, 06, 07, 08, 09, 10, 11, 12, 13, 14, 15, 16, 17, 18
- Winston-Salem/Forsyth County Schools – 14, 15