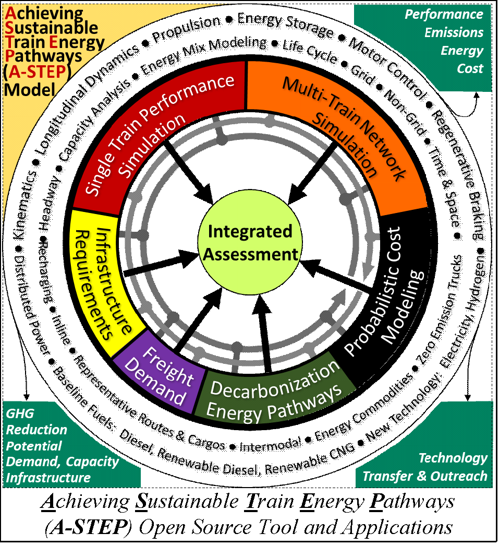
A-STEP (Achieving Sustainable Train Energy Pathways)
A-STEP is a first-of-its-kind, integrated, open-source software tool aimed at guiding freight rail decarbonization decision-making.
It starts from energy pathways and economic forecasts and progresses through traffic assignment, energy intensity analysis, recharging facility assessment, and cost estimation to produce results that can help with decarbonization feasibility assessments. Technological evolution and least-cost capacity expansion form the basis for estimating levelized costs for this energy sourcing transformation, enabling the assessment of benefits and costs for decarbonization options.
The A-STEP toolset includes these modules:
- SysDecarb: Examine the economic implications of ways to decarbonize the the rail freight industry
- OneTrain: Investigate the energy, power, travel time, and other aspects of the movement of a single train over a specified alignment
- NeTrainSim: Investigate the energy, power, travel time, delay, and other aspects of the movement of multiple trains across a network
- ChargeSta: Develop size and cost data for recharging facilities capable of handling specific recharging demands
- Temoa: Examine the energy implications of various decarbonization options in the context of the national energy system, especially the power grid
- Other Tools: During the development of A-STEP, especially SysDecarb and OneTrain, prototypes of the tools were developed first in Excel. These tools can also be opened using Excel from within Windows directly.
This project was funded by
![]()

Download A-STEP on Google Drive
For additional information, email astep-project@ncsu.edu
Screenshots
About the tools
SysDecarb
SysDecarb includes the following modules to examine the economic implications of ways to decarbonize the the rail freight industry:
Module 1 – Decarbonization Pathway: Select an economy-wide decarbonization energy pathway.
Module 2 – Economic Scenario: Select an economic scenario, like high economic growth in combination with population migration to the southeastern and southwestern areas of the US.
Module 3 – Freight Demands: Estimate freight demands consistent with the above assumptions.
Module 4 – Traffic Assignment: Assign the origin-to-destination tonnage flows from Step 3 to links (by direction) on the national rail network.
Module 5 – Train Simulator: Obtain energy intensity inputs by region and propulsion technology, from either the single train train or multi train simulator.
Module 6 – Energy use by type and region: Combine energy intensities with the regional traffic activity outputs from Module 4 to create estimates of energy use by type for each of the regions. Also, produce estimates of charging station energy demands by location (presently nearly 800 railroad yards and intermodal terminals).
Module 7 – Energy Prices: Obtain energy prices by energy source and year from Temoa ($/MWh) for each of the regions based on the decarbonization pathway being studied.
Module 8 – Recharging Facilities: Obtain cost and capacity inputs from the recharging facility design module.
Module 9 – Probabilistic Costs: Estimate costs, for the recharging facility investments identified in Module 8, the unit costs from Module 7, and the incremental changes in rail system configuration, like locomotive investments and conversions from Module 4, to develop total and levelized costs for the decarbonization / economic future combination being examined.
OneTrain
OneTrain allows analysts to study the movement of trains across alignments. It provides estimates of energy intensity (EI), or MWh/net-ton-mile, as affected by the propulsion technology employed, the train configuration, and the alignment. It can model a variety propulsion types like hydrogen, batteries, biodiesel, and overhead catenary. These can be combined as desired. It uses time as the basis for the simulation. It models the delivery of energy from the fuel source to the wheel-rail interface via the intermediate DC bus. It reports temporal trends in speed, acceleration, tractive effort, throttle position, power delivery, braking effort, energy recapture, maximum draw bar force, and many other metrics.
Each locomotive, tender, and car is modeled as a separate “entity”. Each one has a net and tare weight and Davis equation parameter values. The locomotives have a maximum power output, an adhesion coefficient, and an efficiency coefficient that translates power at the rail to power draw from the energy source. The tenders have an energy storage capacity.
Every second, the train’s current speed is compared with a desired speed, and if acceleration is appropriate, the throttle position is increased so a net, positive acceleration is applied. If the deceleration is needed, or constant speed should be maintained, the throttle position is adjusted, or the brakes are applied, or both. In the case of braking, regenerative braking is used first, followed by dynamic braking, and then friction braking. To prevent over-speeding, a backward-moving simulation (from end to start) is conducted first to downward adjust the maximum allowable speeds. A forward-moving simulation is then conducted (from beginning to end of the alignment) to create a second-by-second history of the train traversing the alignment, recording tractive effort, resistance, power demand, energy recovery, energy use, and other metrics.
Any combination of six locomotive types may be simulated: diesel, biodiesel, diesel hybrid, biodiesel hybrid, hydrogen fuel cell, and battery; as well as two types of tenders: battery and hydrogen fuel cell. Moreover, power can be drawn from an external source, like catenary, if it is available.
OneTrain divides the propulsion process into two subprocesses. The first uses kinematics-based equations to calculate second-by-second forces at the wheel-rail interface, representing propulsion or braking. Then, using efficiency tables, it predicts the corresponding instantaneous energy consumption — that is, the power draw or demand— at the DC bus. The second subprocess relates power on the DC bus to the on-board energy source through a second set of efficiency tables. There are separate efficiency tables for each locomotive type (to repeat, diesel, biodiesel, diesel hybrid, biodiesel hybrid, hydrogen fuel cell, and battery). Moreover, when catenary exists, it is used as the energy source, and an additional efficiency table is employed.
NeTrainSim
NeTrainSim (The Network Multi-Train Simulator) is a software application designed to simulate the movement and interactions of multiple trains within a graph-based network, where points are connected by links, and signals are placed only at the intersection of these links. The simulator analyzes the network and trains’ paths to identify potential collisions and resolves them on a first-come, first-served basis by adjusting the network signals state. Additionally, the simulator considers train following, train dynamics, and external resistance.
The simulator operates on a time-driven algorithm utilizing a time step as the base for the calculations. It is recommended to use a small-time step to minimize errors in the simulation results. The algorithm progresses through each time step, updating the positions and states of the trains and analyzing their interactions within the network. At the end of the simulation, a summary file is generated with the key information about the trains’ performance. The summary file includes details such as travel time, traveled distance, and consumed energy.
The energy consumption model considers different train consists, each with its own locomotive characteristics and power type. The model accommodates various energy sources, including diesel, biodiesel, diesel-hybrid, biodiesel-hybrid, and electric trains.
NeTrainSim offers a comprehensive simulation environment for analyzing the behavior of multiple trains on a network. Its modular structure allows for the efficient handling of network calculations, train dynamics, and energy consumption calculations, providing accurate and detailed simulation results.
ChargeSta
ChargeSta focuses on estimating the quantity and dimensions of components required at refueling and recharging facilities so they can serve as intermediary energy transfer points between the energy sources, like the power grid, and the train tenders and locomotives (batteries and hydrogen fuel cells).
Private railroad stakeholders are particularly concerned about the costs of these infrastructure investments. They recognize they need to support a fleet of battery locomotives, hydrogen locomotives, or a mix of the two, but would like to minimize the cost of doing so.
To develop facility designs, for both battery and hydrogen recharging facilities, ChargeSta uses simulation. Trains arrive and deliver depleted tenders; they then depart and leave with ones that are recharged. The facility processes the arrivals to prepare for the departures – the temporal variations in those arrival and departure patterns; as well as considerations of peak load pricing by the utilities – determines how large the facility needs to be, and thus, the operational and capital costs. Each analysis produces results for a specific facility size; and a series of analyses produces a database of configuration results for facilities of various sizes.
The main input for ChargeSta is the target recharging capacity per year (e.g., 90 GWh/year). This demand is portrayed in the form of tenders per year (say 36,000), of a given capacity (e.g., 5 MWh), which are fully or partially depleted (say, on average 50%), which arrive in trains (e.g., in 7200 trains, or about 20 trains per day, with 5 tenders per train). Using a Monte Carlo simulation, the train arrivals (and the departures) are then distributed across the 8,760 hours of the year based on inputs about the distributions (in percentages) of train arrivals by month, day of the week, and hour of the day. The pattern of train departures is input separately, but the number of tenders per train and the total number of train departures is held constant so there is no difference between input and output.
Within the facility, arriving tenders are recharged. Once recharged, tenders are placed in inventory and become part of the supply for satisfying subsequent train departures. A “ready reserve” is assumed to exist in case the normal supply of tenders is exhausted.
Temoa
Temoa (Tools for energy model optimization and analysis) is an open source modeling framework for conducting energy system analysis. The core component of Temoa is an energy system optimization model. Such models have emerged as critical tools for technology assessment and policy analysis at scales ranging from local to global.
Other Tools
During the development of A-STEP, especially EcoTool and the Single Train Simulator, prototypes of the tools were developed first in Excel. Rather than discarding those versions, they continued to be valuable in testing the implementation of the methoodologies involved. Moreover, since they were kept in-step with the methodologies as they evolved, the A-STEP developers thought it might be useful to offer them as supplemental tools within A-STEP. This tab in the A-STEP toolset provides easy access to those tools by allowing the user to bring up Excel within the A-STEP environment. Of course, these tools can also be opened using Excel from within Windows directly.